Discover Hivekraft: Get to Know All Features in 10 Minutes
A guided tour through Hivekraft: dashboard, hive records, colony record book, IoT, AI analytics, and more — with real demo data to explore.
You've heard about Hivekraft and wonder if the software is right for you? Instead of long feature lists, we show you step by step what Hivekraft can do — using the demo beekeeping operation of Maria Bienengarten, a fictional hobbyist beekeeper with 15 apiaries and 47 colonies over four years. Everything you see here, you can try yourself: the demo is accessible without registration.
The Demo Beekeeping Operation: Four Years of Bee Data
Maria started in 2024 as a beginner with 3 apiaries and 12 colonies. Over four years, she systematically built her operation — developed new apiaries, made splits, bred queens, installed IoT sensors, and continuously optimized her management. Today she manages 15 apiaries with 47 colonies, 40 of them active.
The demo data isn't fantasy values. Over 2,300 inspections, 200 treatments, 390 feedings, 32 harvests, and 17,600 IoT sensor readings depict a realistic beekeeping operation over four seasons — including setbacks, overwintering losses, and a learning curve.
Station 1: The Dashboard
The dashboard is your cockpit. After logging in, you see at a glance how your beekeeping operation is doing.
What You See
- Colony overview: Active colonies, average colony strength, total weight
- Weather: Current conditions at your locations (data from the German Weather Service)
- Daily plan: What's scheduled today? Inspections, treatments, feedings
- Alerts: Open warnings — high swarm risk, low food reserves, varroa thresholds
- Season overview: Where are we in the season? What's next?
The dashboard can be personalized: three preset layouts (Standard, Compact, Pro) are available, and individual widgets can be shown or hidden.

Station 2: Locations and Map
Hivekraft manages any number of apiaries. Each location has:
- Name and address: "Orchard at the forest edge, 85356 Freising"
- GPS coordinates: For the map and weather data
- Assigned colonies: Which beehives are here?
- Weather data: Temperature, precipitation, wind — retrieved from the DWD via the Bright Sky API
The interactive map shows all locations at a glance. You can immediately see where your bees are and jump directly from the map to location details.
Weather Data Per Location
For each location, weather data is automatically loaded — based on GPS coordinates. No manual entry, no switching to a weather app. The data comes from the German Weather Service and is reliable and free.
Station 3: Colonies and Hive Records
The centerpiece: the digital hive record. Each colony has its own profile with:
- Basic data: Name/number, location, hive type, status (active/inactive/dissolved)
- Queen: Age, marking, origin, breeding line
- Inspection history: All inspections chronologically
- Treatment history: All varroa treatments
- Harvest history: All harvests with quantity and variety
- Health Score: A composite health indicator (0–100)
- Swarm risk: Calculated from five factors
Quick check: 30-second inspection
Tap on a colony, select "Quick Check." Slide the colony strength slider, select brood status and queen status from predefined options, note any special observations — done. The whole thing takes under 30 seconds.
Full inspection
For the thorough inspection: fill in all fields — colony strength, brood nest (eggs, open and capped brood), queen cells, food, temperament, varroa count, free text. Takes 1–2 minutes per colony.
Voice input
Tap the microphone. Speak your observations: "Colony 7, six frames, queen seen, fresh eggs, food low." The AI assigns everything — you confirm and save.
Station 4: Queen Management
Hivekraft tracks queens as their own entity — not just as a field in the hive record.
What you can record:
- Birth year and marking color (automatically per international color code)
- Origin: own breeding, purchased, swarm queen
- Breeding line and genetics
- Performance data: gentleness, comb adherence, swarming tendency, yield
- Status: active, introduced, lost, culled
Why this matters: Over multiple years, you see which breeding lines produce the best results. In the demo, Maria tested various queen origins over four years — the data clearly shows which lines work best for her.
Station 5: Treatments and Colony Record Book
EU Regulation 2019/6 requires complete documentation of all treatments with veterinary medicines. Hivekraft does this automatically.
Recording a Treatment
For every varroa treatment, you enter:
- Date and treated colony
- Medication (formic acid, oxalic acid, thymol, etc.)
- Batch number and supplier
- Dosage and application method
- Withdrawal period
- Treating person
- Optional: veterinarian and prescription number
Colony Record Book Export
One click on "Export Colony Record Book" generates a PDF to EU standard — bilingual in German and English. All required fields are included, formatted and ready for the veterinarian. This saves hours of manual work.
Click on "Compliance" and "Colony Record Book" in the demo and generate a PDF export. You'll immediately see what the finished document looks like — with all treatment data from the last four years.
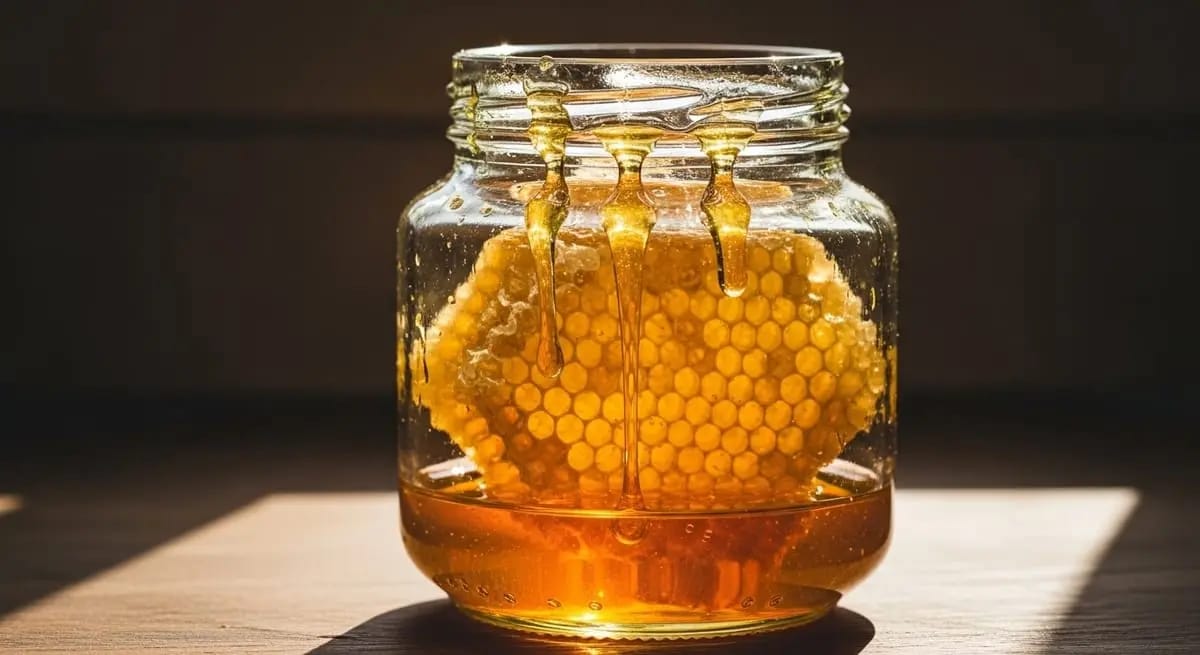
Station 6: Harvest, Bottling, and Labels
The workflow from comb to finished honey jar:
- Record harvest: Date, location, honey variety, weight, water content
- Create bottling: Batch number, jar size, quantity, assigned harvests
- Generate QR code: Automatically from bottling data — links to a public honey page
- Create label: Mandatory information + QR code + design in the label generator
- Honey page: Customers scan the QR code and see origin, beekeeper profile, and quality data
In the demo, 32 harvests are recorded over four years — from the first spring harvest in 2024 to the summer harvest in 2027. You can see how harvest quantities, varieties, and locations evolved over the years.
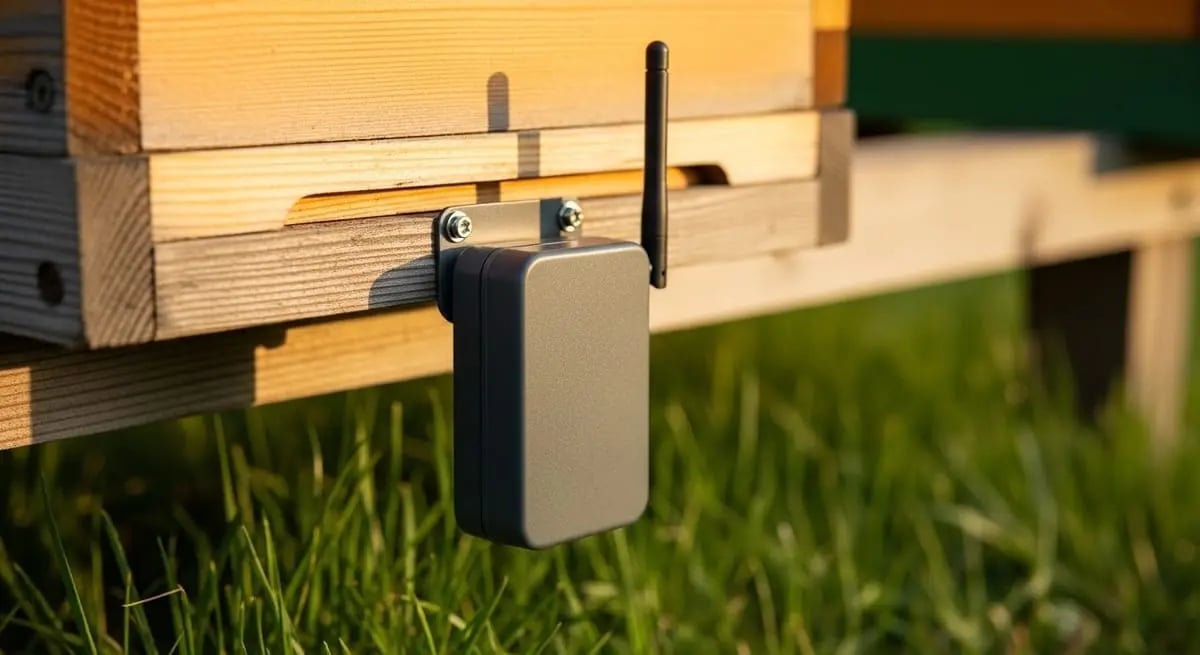
Station 7: IoT Dashboard
Hivekraft supports the integration of hive scales and temperature sensors. In the demo, 12 IoT devices with over 17,600 readings are simulated.
What the IoT Dashboard Shows
- Weight curve: Daily trend and long-term trend for each monitored colony
- Temperature trend: Internal and external temperature in parallel
- Weather data: DWD data for the location, overlaid with scale data
- Events: Inspections, treatments, and feedings as markers on the curve
- Alerts: Automatic warnings for swarm departure, weight loss, or temperature anomalies
Real Weather Data
The demo uses real weather data from the German Weather Service via the Bright Sky API. Weight curves realistically correlate with temperature, precipitation, and sunshine hours — you can see how weather influences the nectar flow.
Station 8: Intelligence and AI
The Intelligence module is the analytical layer above your data.
What it offers:
Hivekraft Intelligence Features
The AI Chat
Hivekraft includes a beekeeping chatbot that answers questions based on your colony data. You can ask:
- "How are my colonies doing?" - Summary of all health scores
- "When should I start the autumn treatment?" - Recommendation based on your varroa data and weather
- "Which colony has the highest swarm risk?" - Ranking with explanation
The chat is not a generic chatbot — it knows your data and gives context-specific answers.
Station 9: Additional Features
Feeding Management
All feedings documented: type (sugar syrup, fondant, honey), quantity, concentration. In the demo, over 390 feedings are recorded.
Inventory
Equipment, tools, hives, supers — all in one place. Those with many apiaries quickly lose track otherwise.
Tasks
To-do lists for beekeeping: "Reduce entrance at Location B," "Buy fondant," "Check split." Tasks can be assigned to colonies or locations.
Community Map
Make visible that you're a beekeeper — on a public map. For swarm catching, honey sales, and networking.
The Three Plans
The free Starter plan is sufficient for beginners with a few colonies. Most active hobbyist beekeepers choose the Pro plan for 4.99 euros per month (or 49 euros per year). The Business plan is for larger operations and associations that need unlimited capacity and API access.
How to Try It Out
Option 1: Demo (no registration)
Open hivekraft.com/demo and log in with the demo account. You'll see Maria's complete beekeeping operation with four years of data — dashboard, hive records, treatments, harvests, IoT. Everything to view and click, without breaking anything.
Option 2: Register for free
Create your own account at hivekraft.com/register. The free Starter plan includes digital hive records, voice input, colony record book, and up to 5 colonies. No credit card needed, no subscription — just try it out.
Option 3: Upgrade as needed
If you find you need more — more locations, IoT, AI chat — you can upgrade at any time. And cancel at any time.
Conclusion: See for Yourself
Feature lists and screenshots can only give an impression. The best way to get to know Hivekraft is to try it. The demo with real (simulated) data shows you in 10 minutes whether the software fits your beekeeping operation.
Hivekraft is developed and hosted in Germany. All data is stored on EU servers, encrypted in transit and at rest. There is no tracking, no advertising, no data selling. Your bee data belongs to you — export at any time.
What you see in 10 minutes in the demo is the result of four years of simulated beekeeping documentation. Imagine what your own data will look like after one, two, three seasons — and what insights you'll gain from it.
To the demo | Register for free | All features
Goodbye Excel: Why Digital Hive Records Are the Future From Paper to Digital: How to Make the Transition in Beekeeping Digital Hive Records: Keep Your Colony in View- Digital Beekeeping with Hivekraft -- All features explained step by step
- Beekeeping for Beginners -- Start your beekeeping journey with the basics course
Less paperwork. More time with your bees.
Hivekraft is free for up to 5 hives. Register in 30 seconds.