Data-Driven Decisions in Beekeeping
Which data truly matters, how to recognise patterns and how to make better decisions with IoT sensors, hive scales and digital tools.
Data-Driven Decisions in Beekeeping

Experienced beekeepers develop an intuition for their colonies. This knowledge is irreplaceable -- but it is subjective, not transferable and does not scale. Anyone managing 30 colonies at several apiaries cannot rely on gut feeling alone.
In this lesson we show how to systematically collect, interpret and use data for better decisions -- not as a replacement for your knowledge, but as an amplifier.
Which Data Matters?
1. Weight Data (highest priority)
Weight is the most informative single value. From the weight trend you can read flow start, flow end, swarm departure, feed consumption and colony strength.
| Weight Change | Interpretation |
|---|---|
| +0.5 to +3 kg/day | Full flow, nectar intake |
| +/-0 kg/day | Flow gap or bad weather |
| -1 to -2 kg suddenly | Swarm departure |
| Steady -0.03 kg/day in winter | Normal consumption (approx. 1 kg/month) |
One hive scale on a reference colony already delivers 80 % of the information -- flow conditions apply to all colonies at the same apiary.
2. Temperature Data
Brood nest temperature (34-36 °C) reveals colony status without opening. A rise to 34-35 °C in spring signals brood rearing has started. A drop below 32 °C may indicate queenlessness.
3. Structured Inspection Notes
The key: structured fields rather than prose. Not "looks good", but: date, weather, colony strength (seams of bees), brood nest (frames, closed/spotty), food ring, queen cells, gentleness (1-4), actions taken.
"C12, 06/05/2025, 18 °C sunny, 9 seams, 6 brood fr., food 2 fr., no QC, queen seen, gentleness 4, super added." -- You can filter and compare this later.
4. Treatment and Harvest Data
Treatment data is mandatory for the EU colony record book. Harvest data per colony (kg, moisture content, variety) provides the foundation for breeding selection and site evaluation.
Recognising Patterns
Flow Start and End
Observe the reference colony
The hive scale shows an increase of +0.5 kg/day or more from the start of the flow -- detectable 2-3 days earlier than visually.
Recognise flow end
When the increase drops to zero or the weight declines, the flow is over. The weight curve tells you whether to extract now or wait for a second flow.
Identify flow gaps
The June gap (2-3 weeks between spring and summer flow) shows up precisely on the hive scale. During this phase swarming impulse can increase.
Detecting Swarming Tendency Early
3-5 days before the swarm, the colony stops bringing in nectar -- the weight curve flattens while other colonies continue gaining. On swarm day: sudden loss of 1-2 kg.
Predicting Overwintering Success
Tracking Colony Development Through the Season
By comparing colony strength (occupied seams of bees) at different time points you recognise the development dynamic:
- Early builder: already 8+ seams by mid-April. Advantage for spring flow, but higher swarming tendency.
- Late builder: reaches full strength only in May. Less spring honey, often better summer flow utilisation.
- Quick decline in autumn: may indicate Varroa damage -- winter bees are being compromised.
- Consistently strong: the ideal -- steady development without extreme peaks and crashes.
Colony and Year Comparison
Comparisons between colonies at the same apiary are the most powerful tool for breeding selection. Since all colonies are exposed to identical environmental conditions, performance differences are primarily genetic.
Method: calculate the deviation of each colony from the site mean. Colonies with consistent positive deviation over 2+ seasons are genetically superior. Year comparisons over at least 3 years reveal reliable trends.
IoT Sensors and Hive Scales

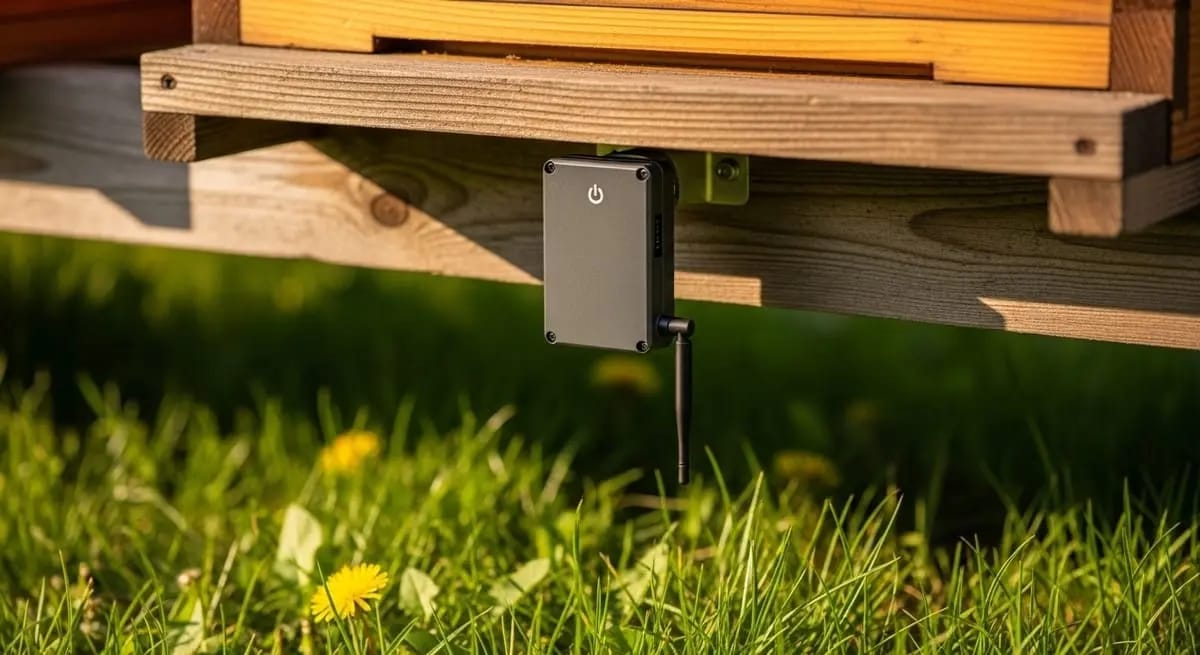
Setting Up a Hive Scale
Location: under the strongest colony at the apiary (reference colony). Healthy, well-developed, young queen.
Surface: absolutely level and firm. Concrete slabs or paving stones.
Data connection: WiFi (home apiary), LoRaWAN (long range, requires gateway) or GSM/LTE (anywhere, approx. 3-5 EUR/month).
Measurement interval: 15-60 minutes is sufficient for most applications.
Digital Colony Card
Hivekraft offers colony cards with apiary management, queen tracking, Varroa dashboard and EU-compliant record book export. Sensor data is imported directly. The AI briefing analyses your data and provides personalised recommendations.
Requirements for a Good App
- Offline capability (often no network at the apiary)
- Fast input (max. 1-2 minutes per colony)
- Structured fields (dropdowns instead of free text)
- Queen management (origin, age, lineage)
- Sensor integration and export (PDF, CSV)
Sensor Networks for Larger Operations
For beekeepers with 20+ colonies, a sensor network is worthwhile: multiple sensors transmit data to a central gateway that forwards it to the internet.
Architecture: sensors at the hives transmit via LoRaWAN or Bluetooth -> gateway at the apiary receives and forwards via 4G/WiFi -> cloud platform stores and visualises -> app shows real-time data and alerts.
LoRaWAN: greatest range (1-10 km), lowest power consumption, requires gateway. WiFi: high bandwidth, only 50-100 m range. GSM/LTE: works anywhere with mobile coverage, higher power consumption. For remote apiaries, LoRaWAN or GSM is the best choice.
Association Benchmarking
Shared monitoring infrastructure
The association finances hive scales at multiple apiaries. Data visible to members on a dashboard.
Real-time flow reports
Weight gain at Site A shows all beekeepers nearby: the flow has started.
Winter loss analysis
Anonymised loss reports reveal clusters by location or treatment method.
When 100 beekeepers share their hive scale data, a flow calendar emerges that is more precise than any weather forecast. The bees measure the flow -- we just need to listen.
From Data to Decisions: Practical Examples
Example 1: Recognising flow end The hive scale has shown weight stagnation for 3 days, although other beekeepers in the association still report gains. Decision: site problem (poor exposure) or end of a local flow? The data helps decide between "wait" and "extract now".
Example 2: Swarm suspicion Colony C05 suddenly shows weight stagnation while C01-C04 at the same apiary continue gaining. Hypothesis: swarming preparation. Decision: unscheduled apiary visit for swarm check on C05. Without the scale, you would not have noticed the difference between colonies.
Example 3: Winter monitoring without opening The hive scale shows a weight loss of 2 kg in one week in January (normal: 0.25 kg/week). Hypothesis: robbing by birds or feed consumption due to residual brood. Decision: check entrance, possibly inspect mouse guard.
Limits of Data Use

The Data-Driven Decision Workflow
Collect data (continuously)
Sensors deliver weight and temperature automatically. At every inspection you enter observations in the colony card. Treatments and harvests are documented.
Check dashboard (weekly)
5 minutes per week: anomalies? Weight drops? Alerts? This can save an unplanned apiary visit -- or trigger a necessary one.
Plan apiary visits based on data
Instead of "I'll just pop by the apiary" you plan specifically: "C05 shows weight stagnation despite flow -- possibly swarming preparation. C08 needs super expansion."
Season evaluation (Autumn/Winter)
Which colonies were most productive? Where were the swarm problems? How did Varroa develop? This analysis feeds into next season's plan.
Your Entry in 3 Stages
Stage 1 (immediately): record structured inspection notes digitally. Weigh honey yield per colony. Quantify mite infestation.
Stage 2 (next season): hive scale on the reference colony. Determine flow start precisely. Compare colonies at the apiary.
Stage 3 (when budget allows): temperature sensors. Sensor dashboard. Initiate association benchmarking.
Knowledge Check
In the final lesson we develop pro-level season planning: from annual calendar to systematic plan.