Phenology: Using Nature as Your Calendar
Phenology for beekeepers: The 10 phenological seasons, indicator plants, becoming a phenology observer, and understanding climate change shifts.
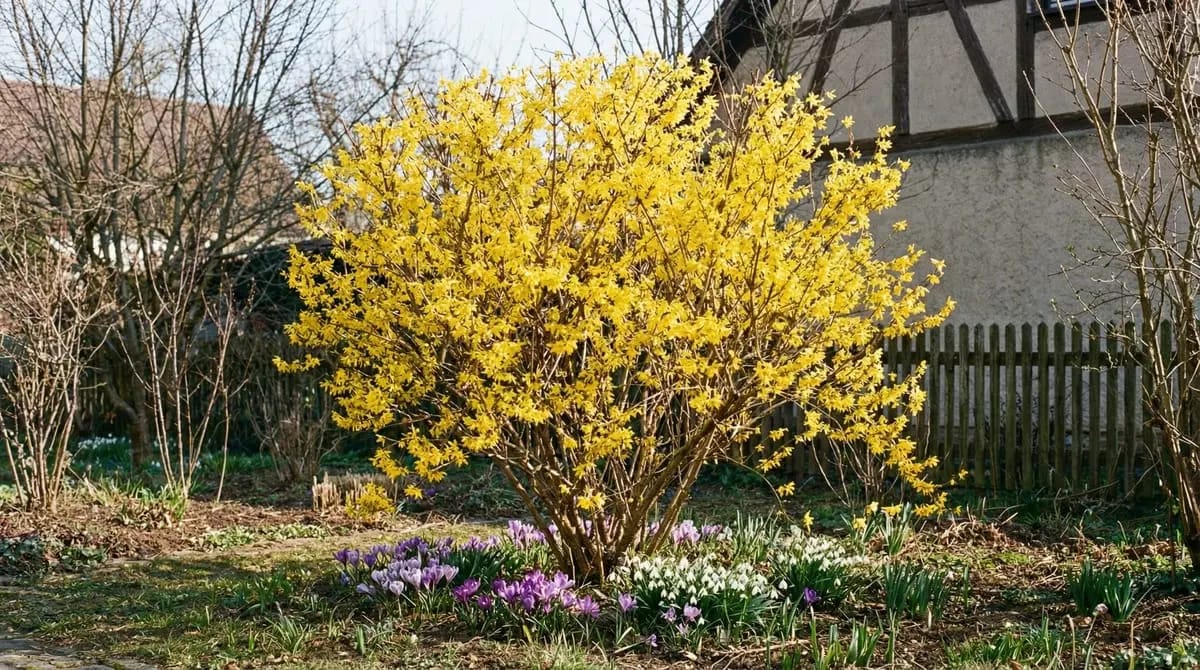
Experienced beekeepers don't look at the calendar -- they look at nature. Phenology (the study of seasonal natural phenomena) is the most reliable tool in beekeeping. Here you will learn about phenological seasons, their indicator plants, and the influence of climate change.
What Is Phenology?
Phenology (from Greek phaino = I appear) is the science that studies the temporal occurrence of seasonal phenomena in nature. Unlike the astronomical or meteorological calendar, phenology is not based on fixed dates but on observable events in the plant and animal world.
Astronomical vs. Phenological
| Calendar | Start of Spring | Determined by | Accuracy for Beekeepers |
|---|---|---|---|
| Astronomical calendar | March 20/21 (spring equinox) | Earth's axis tilt, fixed date | Low -- ignores regional and annual variations |
| Meteorological calendar | March 1 (by definition) | Statistical start, fixed date | Low -- artificially set |
| Phenological calendar | When hazel blooms (regionally: January-March!) | Observation of indicator plants | High -- reflects actual natural conditions |
Nature does not follow a rigid calendar. Apple blossom can begin in Hamburg on May 5th and in the Rhine Valley as early as April 15th -- a difference of 3 weeks! And from year to year, the timing shifts by up to 2-3 weeks depending on temperature and precipitation. Those who keep bees by fixed calendar dates regularly get it wrong. Those who observe indicator plants are always right.
The 10 Phenological Seasons
National weather services (such as the DWD in Germany) divide the year into 10 phenological seasons, each defined by specific indicator plants:
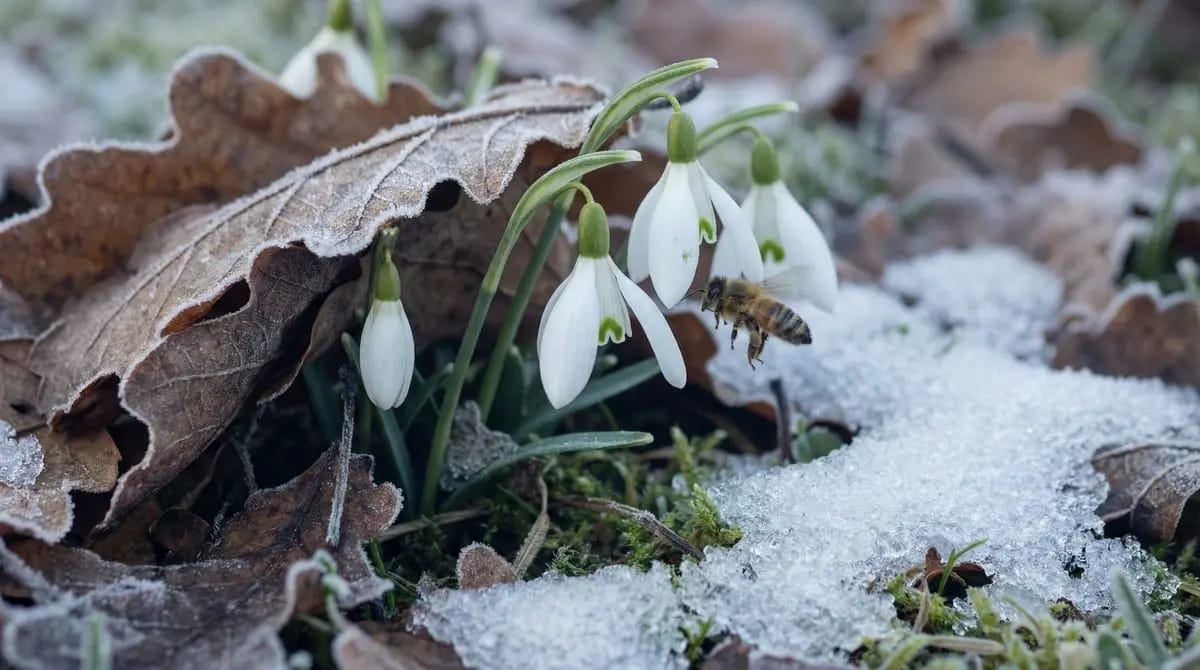
- approx. Jan-Feb1. Pre-springStart: Hazel bloom and snowdrop bloom. The first pollen sources awaken. Bees use mild days for cleansing flights and first pollen foraging trips.
- approx. Feb-Mar2. Early SpringStart: Forsythia bloom and goat willow bloom. FIRST MAJOR FORAGE! Cherry plum blooms. Beekeepers: First thorough inspection, check food reserves.
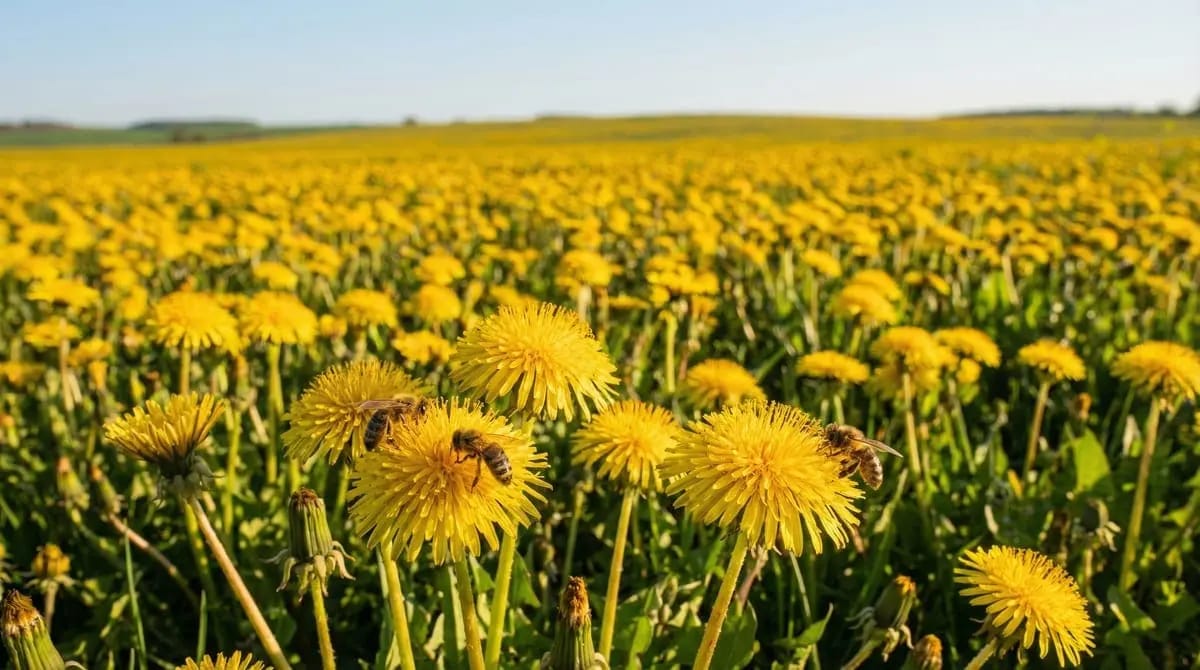
- approx. Mar-Apr3. Full SpringStart: Apple blossom and lilac bloom. Fruit blossom as mass forage. Dandelion blooms. Beekeepers: Expand, add drone comb, swarm control begins.
- approx. May-Jun4. Early SummerStart: Black elderberry bloom. Black locust and rapeseed are flowering. Intensive swarm season! Beekeepers: Swarm control every 7 days, add honey supers.
- approx. Jun-Jul5. MidsummerStart: Large-leaved linden bloom. MAIN FORAGE linden! Forest forage (honeydew) possible. Beekeepers: Prepare last major harvest, observe end of flow.
- approx. Jul-Aug6. Late SummerStart: Early apple ripening (e.g., Klarapfel/Transparent). End of flow in many regions. Beekeepers: Last harvest, summer Varroa treatment, begin feeding!
- approx. Aug-Sep7. Early AutumnStart: Black elderberry fruit ripening. Ivy begins to bloom. Heather blooms. Beekeepers: Complete feeding, prepare mouse guards.
- approx. Sep-Oct8. Full AutumnStart: Pedunculate oak fruit ripening. Leaf coloring. Beekeepers: Leave colonies alone, plan winter treatment, wait for broodless period.
- approx. Oct-Nov9. Late AutumnStart: Pedunculate oak leaf fall. Coloring nearly complete. Beekeepers: Oxalic acid winter treatment during broodless period. Winterize the apiary.
- approx. Nov-Jan10. WinterStart: Dormancy. No more phenological indicator events. Beekeepers: Stay calm! Only check food reserves if needed (by hefting). Plan for next season.
- approx. Jan-Feb
1. Pre-spring
Start: Hazel bloom and snowdrop bloom. The first pollen sources awaken. Bees use mild days for cleansing flights and first pollen foraging trips.
- approx. Feb-Mar
2. Early Spring
Start: Forsythia bloom and goat willow bloom. FIRST MAJOR FORAGE! Cherry plum blooms. Beekeepers: First thorough inspection, check food reserves.
- approx. Mar-Apr
3. Full Spring
Start: Apple blossom and lilac bloom. Fruit blossom as mass forage. Dandelion blooms. Beekeepers: Expand, add drone comb, swarm control begins.
- approx. May-Jun
4. Early Summer
Start: Black elderberry bloom. Black locust and rapeseed are flowering. Intensive swarm season! Beekeepers: Swarm control every 7 days, add honey supers.
- approx. Jun-Jul
5. Midsummer
Start: Large-leaved linden bloom. MAIN FORAGE linden! Forest forage (honeydew) possible. Beekeepers: Prepare last major harvest, observe end of flow.
- approx. Jul-Aug
6. Late Summer
Start: Early apple ripening (e.g., Klarapfel/Transparent). End of flow in many regions. Beekeepers: Last harvest, summer Varroa treatment, begin feeding!
- approx. Aug-Sep
7. Early Autumn
Start: Black elderberry fruit ripening. Ivy begins to bloom. Heather blooms. Beekeepers: Complete feeding, prepare mouse guards.
- approx. Sep-Oct
8. Full Autumn
Start: Pedunculate oak fruit ripening. Leaf coloring. Beekeepers: Leave colonies alone, plan winter treatment, wait for broodless period.
- approx. Oct-Nov
9. Late Autumn
Start: Pedunculate oak leaf fall. Coloring nearly complete. Beekeepers: Oxalic acid winter treatment during broodless period. Winterize the apiary.
- approx. Nov-Jan
10. Winter
Start: Dormancy. No more phenological indicator events. Beekeepers: Stay calm! Only check food reserves if needed (by hefting). Plan for next season.
The Most Important Indicator Plants for Beekeepers
Spring Indicators
| Indicator Plant | Phenological Season | Signal for the Beekeeper |
|---|---|---|
| Hazel (Corylus avellana) -- bloom | Pre-spring | First pollen source! Check food reserves (bees now need energy for brood rearing) |
| Forsythia (Forsythia x intermedia) -- bloom | Early Spring | Willow bloom begins. FIRST INSPECTION in warm weather (above 15 degrees C). Assess colonies. |
| Cherry plum (Prunus cerasifera) -- bloom | Early Spring | Fruit blossom approaching. Expand colonies if needed. Add drone frame. |
| Apple tree (Malus domestica) -- bloom | Full Spring | START SWARM CONTROL! Add honey super if not already done. Forage flow begins! |
| Lilac (Syringa vulgaris) -- bloom | Full Spring | Rapeseed bloom in full swing. Intensify swarm control (every 7 days). |
Summer Indicators
| Indicator Plant | Phenological Season | Signal for the Beekeeper |
|---|---|---|
| Black elderberry (Sambucus nigra) -- bloom | Early Summer | Black locust is flowering. Rapeseed ending soon -- extract rapeseed honey NOW! Swarm season peak. |
| Large-leaved linden (Tilia platyphyllos) -- bloom | Midsummer | MAIN FORAGE linden! Check honey supers. Last major harvest opportunity of the year. |
| Small-leaved linden (Tilia cordata) -- bloom | Midsummer (later) | End of summer forage approaching. Plan last honey harvest. |
| Early apple (e.g., Klarapfel/Transparent) -- ripening | Late Summer | END OF FLOW! Harvest, start summer Varroa treatment, begin feeding! |
Autumn and Winter Indicators
| Indicator Plant | Phenological Season | Signal for the Beekeeper |
|---|---|---|
| Black elderberry (Sambucus nigra) -- fruit ripening | Early Autumn | Complete feeding! Install mouse guards. Follow-up Varroa treatment if needed. |
| Pedunculate oak (Quercus robur) -- fruit ripening | Full Autumn | Leave colonies alone. Prepare winter treatment during broodless period. |
| Pedunculate oak (Quercus robur) -- leaf fall | Late Autumn | Carry out oxalic acid winter treatment (use broodless period!). |
The Phenological Clock: Everything at a Glance
Many national weather services publish interactive Phenological Clocks on their websites that show the current state of the phenological season in different regions. In Germany, the DWD (Deutscher Wetterdienst) maintains such a tool at dwd.de/phaenologie, based on reports from thousands of volunteer phenology observers. For beekeepers, it is an invaluable tool: a single glance shows which phenological season your region is currently in.
Practical tip: Bookmark your country's phenological data resource and check it regularly during the bee season. This way, you always stay in tune with nature.
Phenology and Beekeeping: The Practical Connection
The Phenological-Beekeeping Annual Clock
| Phenological Season | Indicator Plant | Beekeeping Action | Priority |
|---|---|---|---|
| Pre-spring | Hazel blooming | Check food reserves (by hefting), observe dead bee fall at entrance, prepare equipment | Medium |
| Early Spring | Forsythia blooming | First inspection above 15 degrees C, assess colonies (queenright status, food reserves, colony strength) | High |
| Full Spring | Apple blooming | Add honey super, start swarm control (every 7 days), add drone comb | Very high |
| Early Summer | Elderberry blooming | Extract rapeseed honey IMMEDIATELY! Continue swarm control, make splits | Very high |
| Midsummer | Linden blooming | Harvest linden honey, last swarm control, observe end of flow | High |
| Late Summer | Early apple ripening | Last harvest, Varroa summer treatment, begin feeding | Very high |
| Early Autumn | Elderberry fruit ripe | Complete feeding, mouse guards, Varroa follow-up check | High |
| Full Autumn | Acorns falling | Rest! Don't disturb colonies. Prepare winter treatment. | Low |
| Late Autumn | Oak leaf fall | Oxalic acid winter treatment during broodless period | High |
| Winter | Dormancy | Do nothing! Only intervene if food shortage suspected (by hefting). | Low |
The best beekeeper I know doesn't keep a calendar for her inspections. She walks past her hazel bush every day, observes the forsythia in her front garden, and checks the lilac. When the apple blooms, she's at the bee yard. For 30 years, she has never lost a colony due to actions taken too late or too early.
Becoming a Phenology Observer
National weather services maintain networks of volunteer phenology observers. In Germany, the DWD operates a network of about 1,200 volunteer observers across the country. As a beekeeper, you are predestined for this -- you observe nature intensively anyway. And your reports help science document climate changes.
- 1
Register with your national weather service
Visit your national weather service website (e.g., dwd.de in Germany) and register as a volunteer phenology observer. You choose a fixed observation location and observe the same plants there year after year.
- 2
Choose observation plants
Weather services typically specify about 20 indicator plants (hazel, forsythia, apple, lilac, elderberry, linden, oak, etc.). You don't have to observe all of them -- every single report is valuable.
- 3
Report regularly
In spring, observe every 2-3 days; in summer, weekly. Note the phases: bud swelling, bloom start, full bloom, bloom end, fruit ripening, leaf coloring, leaf fall. Report via online form or app.
- 4
Scientific contribution
Your data feeds into climate research and pollen forecasts. At the same time, you sharpen your eye for nature -- which makes you a better beekeeper.
Climate Change and Phenology: What Is Shifting
The Facts
Long-term data from weather services (since 1951 in Germany) show clear trends:
| Indicator Plant | Average Bloom Start 1960s | Average Bloom Start 2020s | Shift |
|---|---|---|---|
| Hazel | Late February / early March | Early to mid February | approx. 2-3 weeks earlier |
| Forsythia | Mid April | Late March / early April | approx. 2 weeks earlier |
| Apple blossom | Early May | Mid to late April | approx. 14 days earlier |
| Linden bloom | Early July | Late June | approx. 8 days earlier |
| Pedunculate oak leaf fall | Early October | Mid October | approx. 10 days later |
What Does This Mean for Beekeepers?
Keeping Your Own Phenological Observations
Your Personal Phenology Calendar
- Notebook or calendar app (e.g., Hivekraft)
- Camera for photos of indicator plants
- Thermometer for daily temperatures (optional)
- 5-10 defined observation plants at your location
1. Select indicator plants Choose 5-10 plants that you regularly see on your way to your bees. Ideal are:
- 1 hazel bush (pre-spring indicator)
- 1 forsythia or goat willow (early spring indicator)
- 1 apple tree (full spring indicator)
- 1 elderberry (early summer indicator)
- 1 linden (midsummer indicator)
- 1 pedunculate oak (autumn indicator)
2. Observe regularly
- Spring (Feb-May): Every 2-3 days
- Summer (Jun-Aug): Once per week
- Autumn (Sep-Nov): Every 3-5 days
- Note: Date, plant, phase (bud swelling, bloom start, full bloom, bloom end, fruit ripening, leaf coloring, leaf fall)
3. Link with beekeeping activities Enter your beekeeping actions in the same calendar. After 2-3 years, you will recognize patterns: "When the forsythia blooms, my first inspection is due." "When the elderberry blooms, the rapeseed honey must come out."
4. Year-on-year comparison Compare the data from year to year. This reveals whether your location is earlier or later than average and whether trends are emerging.
Hivekraft Phenology Feature
Hivekraft offers an integrated Phenology Module that helps you digitally record phenological observations and link them with your beekeeping activities. You can define indicator plants at your location, enter observation phases, and recognize trends over the years. The app automatically reminds you of due observations and shows you which phenological season your location is currently in.
Additionally, Hivekraft uses weather data and phenological data to provide you with forage forecasts and action recommendations for your location -- turning phenology into a practical tool for better beekeeping decisions.
Summary
Core knowledge: Phenology for beekeepers
Knowledge Check
Congratulations -- you have completed the Forage Plants course! You now know the most important nectar and pollen sources throughout the year, understand how to improve the forage landscape, and have learned the language of nature. Use this knowledge to optimally support your bees and keep them in harmony with nature.