Digital Varroa Tracking: Dashboard and Forecasts
Interpreting methods, seasonal thresholds and the current status of each colony -- why structured Varroa records beat guesswork.
You diligently measure mite drop, keep records of your treatments, and try to stay on top of everything. But with 5, 10, or more colonies, it quickly becomes overwhelming: which colony had the high infestation again? Was the last treatment 3 or 4 weeks ago? Is the mite drop in the safe range?
In this lesson, we show why digital Varroa records outperform paper cards, how to compare measurements method by method and how the current dashboard classifies seasonal thresholds and each colony's latest status.
Why Track Digitally?
The Varroa mite cannot be assessed with a single glance. Its management is a process spanning the entire year, where trends, thresholds, and timing matter. This is exactly where analogue methods reach their limits.
The Limits of Paper Documentation
| Criterion | Paper Hive Record | Digital Tracking |
|---|---|---|
| Recording mite drop | Write down the value | Enter value, automatic calculation per day |
| Interpreting measurements | Reconcile method, unit and season yourself | Latest measurement with method, unit and status per colony |
| Checking thresholds | Calculate yourself | Profile- and season-aware status |
| Comparing colonies | Lay out multiple cards side by side | Dashboard with all colonies at a glance |
| Tracking treatment | Look it up in the calendar | Assign treatment and follow-up measurement to the colony |
| Year-on-year comparison | Search old cards and compare | Historical data instantly accessible |
| Colony record book (EU requirement) | Keep a separate book | Automatically integrated, PDF export |
Interpreting Comparable Measurements
The current Hivekraft dashboard does not display an infestation curve. It classifies the latest documented measurement for each colony using its method, unit, season and selected threshold profile. To build a meaningful series in your records, the entries must remain methodologically comparable.
Four Details Belong with Every Value
- Method: for example natural mite fall, powdered-sugar sample or wash
- Unit: use only the unit intended for that method
- Period: for bottom-board inserts, record start, end and the calculated mites per day
- Context: record date, colony condition and whether the measurement was before or after treatment
A value in mites per day is not directly comparable with mites per 100 bees. Do not switch methods unnoticed within a series, and interpret changes only after a follow-up measurement under comparable conditions.
Thresholds: When Does It Become Critical?
German bee institutes recommend the following thresholds for natural mite drop:
| Period | Natural Mite Drop/Day | Assessment | Action |
|---|---|---|---|
| March -- May | Under 0.5 | Normal | None |
| March -- May | 0.5 -- 3 | Elevated | Monitor closely |
| March -- May | Over 3 | Critical | Consider early treatment |
| June -- July | Under 3 | Normal | Continue monitoring |
| June -- July | 3 -- 10 | Elevated | Prepare treatment |
| June -- July | Over 10 | Critical | Treat immediately |
| August -- September | Under 1 (after treatment) | Good | Continue monitoring |
| August -- September | Over 3 (after treatment) | Insufficient | Follow-up treatment needed |
| October -- November | Under 0.5 | Well winterised | Plan winter treatment |
| October -- November | Over 1 | Problematic | Seek advice |
The values above apply to the natural mite drop on the monitoring board. For the powdered sugar or alcohol wash method: over 3 mites per 100 bees (approx. 300 bees = half a cup) means treatment is needed. This method is more accurate since it directly measures the current infestation.
Mite Drop Forecasts: Predicting the Future
One of the greatest advantages of digital tracking is the ability to create forecasts. Based on the trend so far, the software can calculate when thresholds will likely be exceeded.
How Forecasts Work
The calculation is based on a simple yet powerful model:
- Data basis: The last 3-4 mite drop measurements
- Growth rate: The exponential mite reproduction is modelled (doubling every 3-4 weeks during the brood phase)
- Seasonal adjustment: Temperature and brood development are factored in
- Projection: The expected mite drop for the next 2-4 weeks is calculated
Example: Your colony shows a mite drop of 2 per day in early June. With a doubling rate of 3 weeks, the projected mite drop would be:
- End of June: approx. 4 mites/day
- Mid-July: approx. 8 mites/day
- End of July: approx. 16 mites/day -- well above the threshold
A forecast thus shows you already in early June: treatment needed by early to mid-July at the latest.
Limitations of Forecasts
Forecasts are estimates, not guarantees. The following factors can distort them:
- Reinvasion: Mites from collapsing neighbouring colonies can suddenly spike the infestation
- Swarming: A swarm takes many mites with it -- the infestation drops suddenly
- Weather: Cold spells or heat waves affect brood development and mite reproduction
- Nectar gaps: Brood breaks temporarily reduce mite reproduction
Therefore: forecasts are a valuable planning tool but do not replace regular measurement.
The Varroa Dashboard in Practice
A good Varroa dashboard shows you the status of all your colonies at a glance. Here are the key elements you need:
Status Overview of All Colonies
A traffic-light display immediately shows which colonies need attention:
- Green: Mite drop in the normal range, no action needed
- Yellow: Elevated mite drop, closer monitoring needed
- Red: Threshold exceeded, treatment needed
Latest Measurement per Colony
The colony overview shows the latest documented measurement with its method, unit, seasonal threshold and status. Compare only values obtained with the same method, and document post-treatment checks as new measurements.
Treatment History
Every treatment is captured with date, product, dosage, and result:
- Which product was used?
- How effective was it (mite drop before/after)?
- When is the next treatment due?
Automatic Alerts
The system actively warns you when:
- A threshold is exceeded
- The next monitoring measurement is due
- A treatment did not show the expected efficacy
- The forecast predicts a critical infestation
Experienced beekeepers develop a good feel for their colonies -- but even professionals sometimes miss gradual changes. Digital tracking recognises trends objectively and early. It does not replace your beekeeping knowledge but amplifies it with data.
From Measurement to Decision
The real goal of tracking is not collecting data but making better decisions. Here is a typical decision flow:
- 1
Measure
Insert monitoring board or perform powdered sugar test. Enter the mite drop value into the app.
- 2
Assess
The dashboard shows you: is the value in the green, yellow, or red range? How has the value changed since the last measurement?
- 3
Check the Forecast
When will the threshold likely be reached? Do you still have time, or must action be taken now?
- 4
Decide
Based on measurement, trend, and forecast: continue monitoring? Prepare treatment? Treat immediately?
- 5
Act and Document
Carry out the measure and record it in the system. Check efficacy at the next measurement.
Keeping Multiple Colonies in View
The more colonies you have, the more valuable digital tracking becomes. With 10+ colonies, keeping track without a system becomes nearly impossible.
Apiary Comparison
If you have colonies at different locations, the dashboard reveals differences:
- Does one apiary have generally higher mite infestation? (Possible cause: untreated colonies nearby)
- Do colonies at different apiaries respond differently to the same treatment?
- Are there location-specific factors (proximity to other beekeepers, reinvasion pressure)?
Using Historical Data
After 2-3 years of digital tracking, you have a valuable data treasure:
- Recognise annual patterns: In which month does the infestation typically become critical?
- Compare treatment success: Which method works best for your colonies?
- Support breeding decisions: Which colonies consistently show low mite infestation?
The Future: IoT and Automatic Monitoring
The next level of Varroa tracking will be enabled by IoT sensors (Internet of Things) on the beehive:
Hive scales can indirectly indicate Varroa:
- Unexpected weight loss can point to colony collapse due to Varroa
- Weight changes after treatment show the treatment's impact
Temperature sensors provide supporting clues:
- A temperature pattern measured centrally above the brood area may indicate brood activity
- Temperature alone cannot establish broodlessness or the correct treatment date; further observations and, where necessary, an inspection are required
Acoustic sensors (in research):
- Certain frequency patterns may indicate elevated Varroa infestation
- Not yet field-ready, but a promising research direction
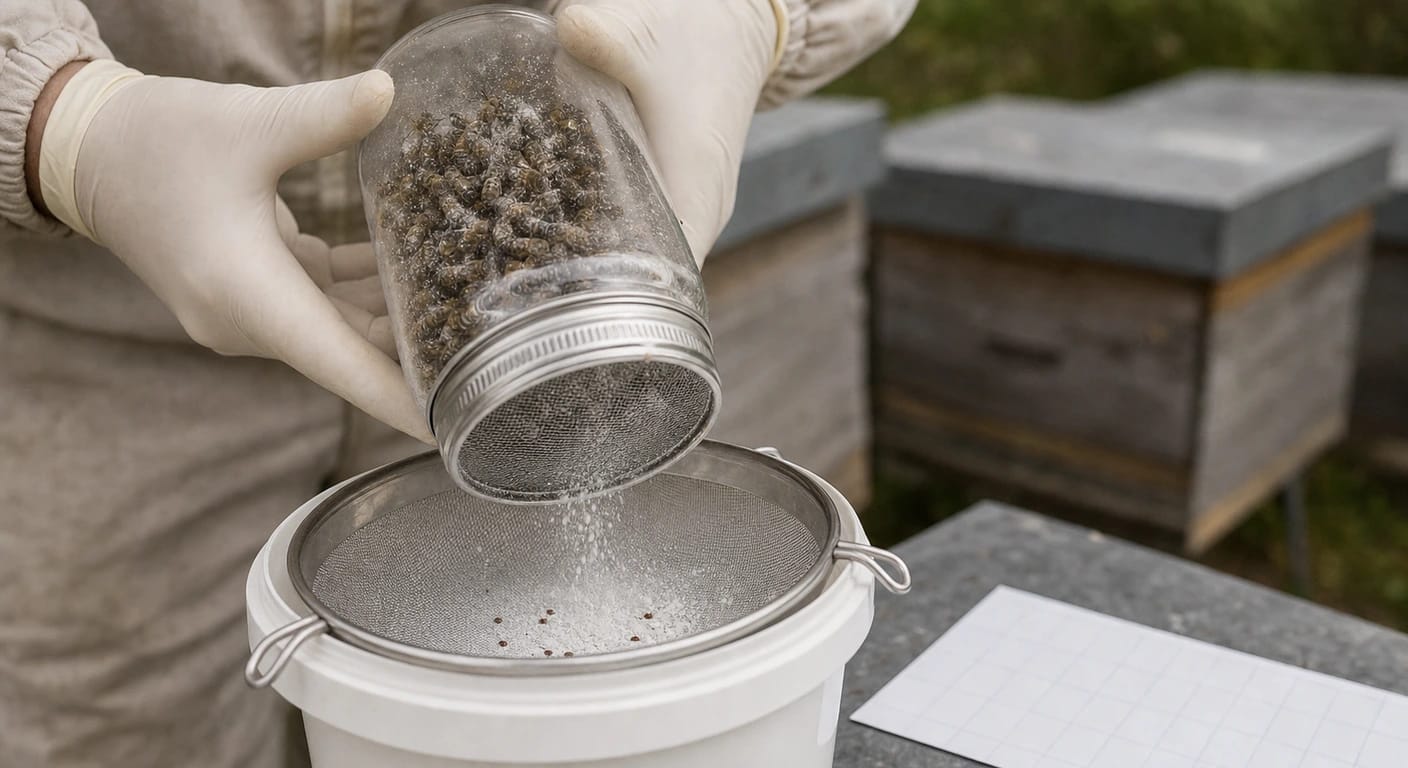
Hivekraft shows seasonal, profile-aware thresholds and a method-aware colony table with the latest measurement, heat bar and status. Measurements and treatments are still entered deliberately by the beekeeper; the display supports interpretation but does not measure or diagnose on its own.
Knowledge Check
In the next and final lesson, we bring everything together: Integrated Varroa Management combines monitoring, biotechnical and chemical methods, and breeding progress into one comprehensive concept.